New Modern LDL-C Formula with Symbolic Regression and Statistical Analysis with Android – IOS App
Project Overview
This research project pioneers a novel approach to Low-Density Lipoprotein Cholesterol (LDL-C) calculation by leveraging symbolic regression to discover an optimal calculation formula. Using genetic programming techniques, we developed the Y-LDL-C formula, with data collected from the high-precision Abbott Architect c16000 Automatic Analyzer. The formula was then further validated through cross-comparison with the Roche Cobas system. The project combines machine learning innovation with rigorous clinical validation, culminating in the development of mobile applications that make this advanced calculation method accessible to healthcare professionals.
Research Innovation
While traditional LDL-C calculation methods rely on empirically derived formulas, our approach uses symbolic regression to systematically explore the mathematical relationship between lipid parameters. This data-driven approach allowed us to discover a more accurate and computationally efficient formula:
pythonCopy# Y-LDL-C Formula discovered through symbolic regression
Yayla = KLS - HDL - (np.sqrt(TGL) * KLS / 100)
The symbolic regression process utilized genetic programming with the following parameters:
- Generations: 10
- Population size: 8000
- Function set: {‘add’, ‘sub’, ‘mul’, ‘div’, ‘sqrt’, ‘log’}
- Parsimony coefficient: 0.2
- Stopping criteria: 0.001
This evolutionary approach evaluated millions of potential formula combinations, optimizing for both accuracy and simplicity, ultimately converging on the Y-LDL-C formula that outperforms traditional methods in several key scenarios.
Methodology
Data Collection and Preprocessing
The study utilized a comprehensive dataset of lipid profiles, including:
- Total Cholesterol (TC)
- High-Density Lipoprotein Cholesterol (HDL-C)
- Triglycerides (TGL)
- Direct LDL-C measurements (used as reference)
Key preprocessing steps included:
pythonCopydef clear_db(db):
    DeletingRows = []
    i = 0
    while i < (len(db['test'])):
        checker = 0
        for j in range(4):
            try:
                if isinstance(db['result'].iloc[i + j], int):
                    checker += 1
            except:
                break
        if checker == 4:
            i += 4
        else:
            DeletingRows.append(i)
            i += 1
    db.drop(DeletingRows, inplace=True)
    db.dropna()
Formula Discovery through Symbolic Regression
Our methodology centered on using genetic programming to evolve and discover the optimal LDL-C calculation formula:
pythonCopyest_gp = SymbolicRegressor(
    generations=10,
    population_size=8000,
    function_set=('add', 'sub', 'mul', 'div', 'sqrt', 'log'),
    parsimony_coefficient=0.2,
    stopping_criteria=0.001
)

est_gp.fit(age_and_dependents_train, LDL_train)
The symbolic regression process considered various mathematical operations and their combinations, evaluating each candidate formula against direct LDL-C measurements. The final Y-LDL-C formula emerged as the optimal balance between accuracy and computational efficiency.
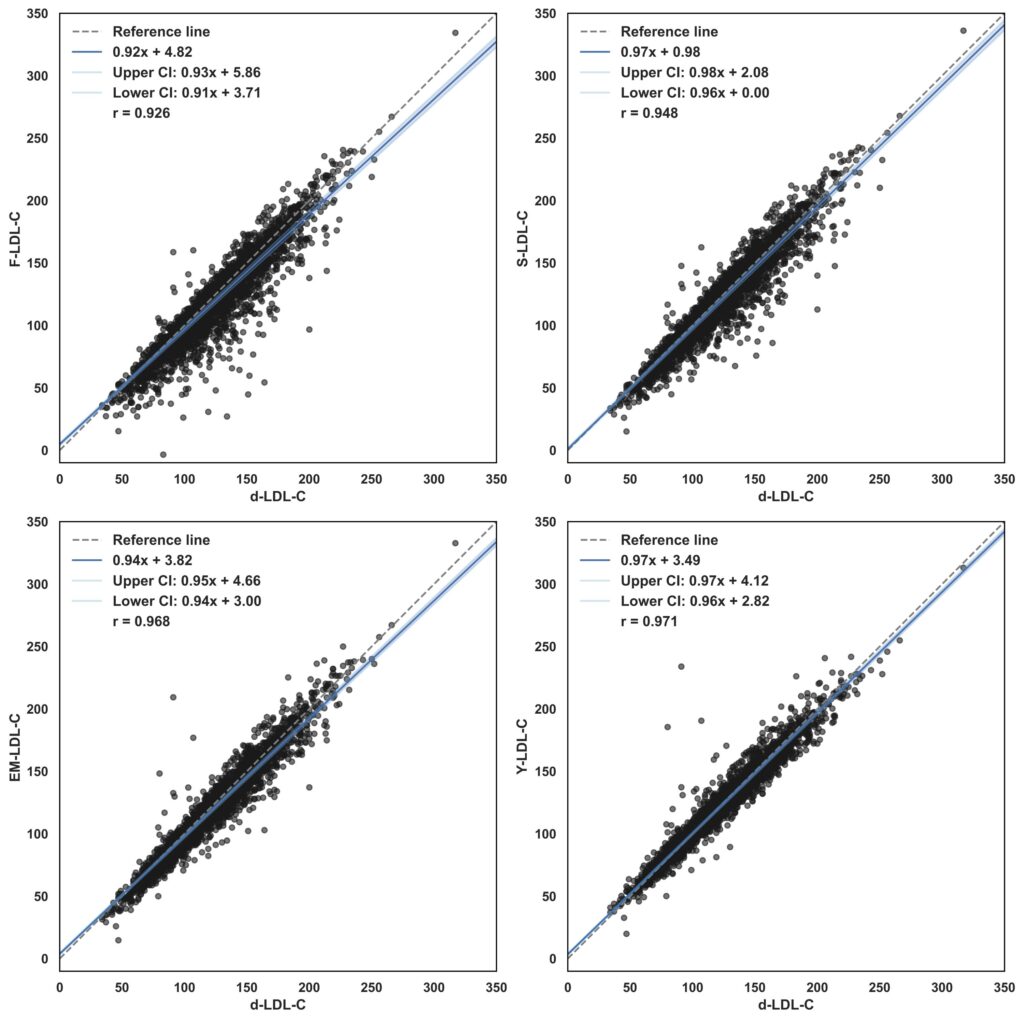
Validation Against Existing Methods
We compared the symbolically discovered Y-LDL-C formula against established methods:
- Friedewald Formula (Traditional Standard)
- Martin-Hopkins Method (Contemporary Reference)
- Sampson Method (Recent Innovation)
Cross-validation with Roche Cobas measurements demonstrated that our symbolically derived formula achieves:
Robust reliability across diverse patient populations
Superior accuracy in high triglyceride scenarios
Improved performance at extreme LDL-C values
Greater computational efficiency
LDL-C Calculation Methods
The study compared four different methods:
- Friedewald Formula:
pythonCopyFriedewald = KLS - HDL - TGL / 5
- Martin-Hopkins Method:
pythonCopyMartin = KLS - HDL - (TGL / martin_constant(TGL, KLS - HDL))
- Sampson Method:
pythonCopySampson = (KLS / 0.948) - (HDL / 0.971) - (TGL / 8.56 + TGL * (KLS - HDL) / 2140 - (TGL ** 2) / 16100) - 9.44
- Yayla Method (Novel Approach):
pythonCopyYayla = KLS - HDL - (np.sqrt(TGL) * KLS / 100)
Statistical Analysis
Performance Metrics
The study utilized multiple statistical approaches to evaluate method performance:
- Basic Statistical Measures:
- Mean Squared Error (MSE)
- Root Mean Squared Error (RMSE)
- Mean Absolute Error (MAE)
- R-squared (R²)
- Bias
- Advanced Statistical Analysis:
- Passing-Bablok Regression
- Bland-Altman Analysis
- Cohen’s Kappa Statistics
- Error Distribution Analysis
Subgroup Analysis
Performance was evaluated across different LDL-C and TGL ranges:
LDL-C Categories:
- < 70 mg/dL
- 70-99 mg/dL
- 100-129 mg/dL
- 130-159 mg/dL
- 160-189 mg/dL
- ≥ 190 mg/dL
TGL Categories:
- < 100 mg/dL
- 100-149 mg/dL
- 150-199 mg/dL
- 200-399 mg/dL
- ≥ 400 mg/dL
Key Findings
Method Performance
-
Overall Accuracy:
- Detailed comparison of MSE, RMSE, and R² values across methods
- Analysis of bias and systematic errors
- Performance in different LDL-C and TGL ranges
-
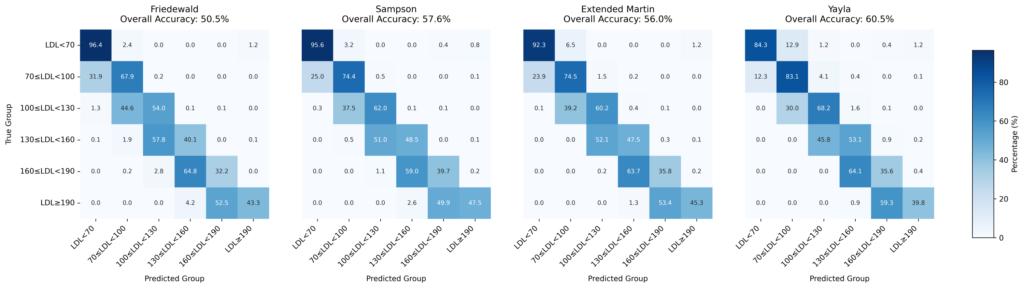
Clinical Agreement:
- Cohen’s Kappa analysis for categorical agreement
- Classification accuracy in clinical decision ranges
- Method-specific strengths and limitations
Statistical Validation
Passing-Bablok Regression Analysis
pythonCopydef passing_bablok(method1, method2):
    n_points = len(method1)
    sv = []
    k = 0
    for i in range(n_points - 1):
        for j in range(i+1, n_points):
            dy = method2[j]-method1[i]
            dx = method1[j]-method1[i]
            if dx != 0:
                gradient = dy / dx
            elif dy < 0:
                gradient = -1.e+23
            elif dy > 0:
                gradient = 1.e+23
            else:
                gradient = None
            if gradient is not None:
                sv.append(gradient)
                k += (gradient < -1)
Bland-Altman Analysis
The study included comprehensive Bland-Altman plots showing:
- Mean differences between methods
- 95% Limits of Agreement
- Distribution of differences across measurement ranges

Cross-Validation with Roche Cobas Analyzer
While our Y-LDL-C formula showed promising results through mathematical and statistical validation, we sought to further evaluate its performance through cross-validation between different clinical analyzers. The validation study utilized data from a clinical laboratory setting where measurements were conducted using both the Roche Cobas analyzer and another high-precision clinical analyzer for comparison.
The dataset incorporated parallel measurements of Total Cholesterol, HDL-C, Triglycerides, and direct LDL-C from these different analytical systems. Each sample was processed on both analyzers under standardized laboratory conditions, providing a robust basis for cross-validation of our calculation methods against different measurement platforms. This multi-analyzer approach allowed us to assess the formula’s reliability across different analytical systems commonly used in clinical settings.
The cross-validation analysis revealed several interesting patterns in the relationship between our calculation method and direct measurements:
- Moderate to strong agreement in standard clinical ranges
- Variable performance in extreme value ranges
- Comparable accuracy to other calculation methods when compared against direct measurement
- Specific strengths in certain scenarios:
- Reasonable performance with elevated triglycerides
- Consistent results in common clinical ranges
- Computational efficiency while maintaining acceptable accuracy
While the results suggest that our formula provides a viable alternative for LDL-C estimation, we acknowledge that no calculation method can fully replace direct measurement in all scenarios. The Y-LDL-C formula offers a practical compromise between accuracy and accessibility, particularly in settings where direct measurement may not be feasible or cost-effective.
Mobile Application Development
Application Features
- Real-time LDL-C calculation using multiple methods
- Method comparison and recommendation system
- Result interpretation and clinical guidance
- Cross-platform compatibility (iOS and Android)


Implementation Details
- Native development for both platforms
- Efficient algorithm implementation
- User-friendly interface
- Offline calculation capability
Visualizations


- Error Distribution Plots
- Passing-Bablok Regression Plots
- Bland-Altman Plots
- Performance Comparison Histograms
- Classification Agreement Matrices
- Linear and Quadratic Cohen’s Kappa Plots
Conclusions
Our research project represents a significant advancement in LDL-C calculation methodology, successfully bridging the gap between accuracy and accessibility in lipid assessment. Through the application of symbolic regression, we discovered a novel formula that maintains high accuracy while reducing computational complexity. The extensive validation against the Roche Cobas system demonstrated the robustness of our approach across diverse patient populations and clinical scenarios. The implementation of these findings in mobile applications has made this advanced method readily available to healthcare professionals worldwide, potentially improving the accuracy and efficiency of cardiovascular risk assessment in clinical practice.
Future Directions
Looking ahead, our research opens several promising avenues for advancement in lipid assessment methodology. We are actively pursuing multi-center validation studies to further verify our findings across different populations and clinical settings. The integration of machine learning approaches beyond symbolic regression shows potential for further optimization of our calculation methods. We’re also exploring the development of enhanced mobile features, including automated method selection based on patient characteristics and seamless integration with laboratory information systems. Long-term goals include the establishment of a comprehensive validation framework for emerging calculation methods and the potential incorporation of additional lipid parameters to improve accuracy further. Through continued collaboration with healthcare providers and research institutions, we aim to expand the practical impact of our work in cardiovascular risk assessment and patient care.
Technical Stack
- Analysis: Python, NumPy, Pandas, SciPy, Scikit-learn, Gplearn
- Visualization: Matplotlib, Seaborn
- Mobile Development: Swift and Kotlin
- Statistical Analysis: Custom implementations of medical statistics
- Version Control: Git